Create A Simple Python Microservice With Elasticsearch APM Monitoring In 5 Minutes— Source Code Attached!! ⏬
Let us understand how Microservices will work in a bigger infrastructure like Tech Startups using this Small Replica of Python Microservice Environment.

The tone of this article is to educate how the small services interact with each other in a low-level and how the monolithic infrastructure is broken down to the Microservices environment and how it can be monitored.
Let us quickly create a simple Flask API with logging messages to SQLite3 and Redis simultaneously. And, we’ll use Elasticsearch to monitor the application and the transaction logs.
# Prerequisites for Beginners using Python:
- Install
Flask,Redis, andSQLite3, you can run the below command:
pip install flask sqlite3 redis- Install the
Elastic APM agentusing pip:
pip install "elastic-apm[flask]" psutil*Additional Documentation => Elastic APM agent
# What is Redis? Why we use Redis and SQL?
Redis is an open-source, in-memory data structure store that is used as a database, cache, and message broker. Redis is a popular choice for a wide range of applications because of its speed, flexibility, scalability, and ease of use.
Redis and SQL are two different types of databases that are used for different purposes. While SQL databases, such as MySQL and PostgreSQL, are used to store structured data in a relational manner, Redis is an in-memory data store that supports a wide variety of data structures.
That being said, SQL databases are the preferred choice for many applications that require structured, relational data storage and complex querying capabilities. Redis is often used in conjunction with SQL databases, with Redis being used for quick access to frequently used data and SQL being used for more persistent storage.
# Why Chose Elastic APM or Observability Solution for Monitoring?
Elastic APM (Application Performance Monitoring) is a feature of the Elastic Stack that allows users to monitor the performance and behavior of their applications in real-time. It provides a simple and intuitive user interface that diagnose performance issues. It can be used to identify and resolve bottlenecks, reduce downtime, and improve the overall user experience. It is very easy to setup compared to other Monitoring solutions.
NOTE: It is not mandatory to configure a monitoring setup for simple applications but it provides additional insights of how an application and users are interacting with the network. So, using monitoring here is to understand the basics of how application and API works.
Once all the prerequisites are met, you can directly copy-paste the below code snippet.
#app.py

import sqlite3
import redis

from flask import Flask, request
from elasticapm.contrib.flask import ElasticAPM

app = Flask(__name__)

# Configure to use ELASTIC_APM in your application's settings
app.config['ELASTIC_APM'] = {
# Set the required service name. Allowed characters:
# a-z, A-Z, 0-9, -, _, and space
'SERVICE_NAME': 'Redis Sqlite and Python Flask Microservice',

# Use if APM Server requires a secret token
'SECRET_TOKEN': 'xXXXXCrlh5XXX6K',

# Set the custom APM Server URL (default: http://localhost:8200)
'SERVER_URL': 'https://02c2630bXXXXXXXXXXXXXXX.apm.us-central1.gcp.cloud.es.io:443',

# Set the service environment
'ENVIRONMENT': 'production',

'DEBUG': 'DEBUG'
}

apm = ElasticAPM(app)

# app = Flask(__name__)

redis_conn = redis.Redis(host="localhost", port=6379, db=0)

@app.route("/log", methods=["POST"])
def log():
    message = request.form["message"]

    # Store the message in SQLite
    sqlite_conn = sqlite3.connect("logs.db")
    cursor = sqlite_conn.cursor()
    cursor.execute("CREATE TABLE IF NOT EXISTS logs (message text)")
    cursor.execute("INSERT INTO logs (message) values (?)", (message,))
    sqlite_conn.commit()
    sqlite_conn.close()

    # Store the message in Redis
    redis_conn.rpush("logs", message)

    return "Logged: {}".format(message)

if __name__ == "__main__":
    app.run(debug=True)
Let us split the code into three sections,
1. Flask API section
2. Redis and SQLite3 i.e. the Database section
3. Elasticsearch APM section (Not Mandatory)
1. Flask API section
You can create a simple Flask API using the below Hello World code snippet.
from flask import Flask

app = Flask(__name__)

@app.route("/")
def hello():
    return "Hello, World!"

if __name__ == "__main__":
    app.run(debug=True)
NOTE: The above Flask API snippet will host your application in the localhost port
5000, i.e. you can interact with the application using the below curl command or through Browser directly.
#Run the below command in the terminal
curl -XGET http://localhost:5000/
2. Redis and SQLite3
Post the installation of the SQLite3 and Redis packages, you would need to run the Redis Server to accept connections and logs from the Flask application.
So, open a new terminal or shell and run redis-server. This should start the Redis Server in the port 6379. It is a default port so you can change, if required in the code.
The reason why I’m using SQLite3, because it is lightweight database management system built over SQL standard and it is easy to setup without any server requirements compared to the MySQL or other SQL DB systems.
import sqlite3
import redis

redis_conn = redis.Redis(host="localhost", port=6379, db=0)

@app.route("/log", methods=["POST"])
def log():
    message = request.form["message"]

    # Store the message in SQLite
    sqlite_conn = sqlite3.connect("logs.db")
    cursor = sqlite_conn.cursor()
    cursor.execute("CREATE TABLE IF NOT EXISTS logs (message text)")
    cursor.execute("INSERT INTO logs (message) values (?)", (message,))
    sqlite_conn.commit()
    sqlite_conn.close()

    # Store the message in Redis
    redis_conn.rpush("logs", message)

    return "Logged: {}".format(message)
From the code, the SQL database is created, if it is not available and the application logs will be inserted to the database. Post that, the logs will be pushed to the Redis database. Finally, it return a Logged message for successful output.
NOTE: The
SQLite3will log a file calledlogs.dband theRediswill log a file calleddump.rdb. You can read thelogs.dbusing an online SQLite viewer. And, you can read therdb fileby converting the dump.rdb to a JSON file. This Git Repo will provide the redis-rdb-tools to convert to JSON.
3. Elasticsearch APM section
It is a straight-forward implementation, just create an account on Elastic Cloud. Use it as a Trial Basis if you’re testing. Create a cluster with the APM Server i.e. the Integration Server.
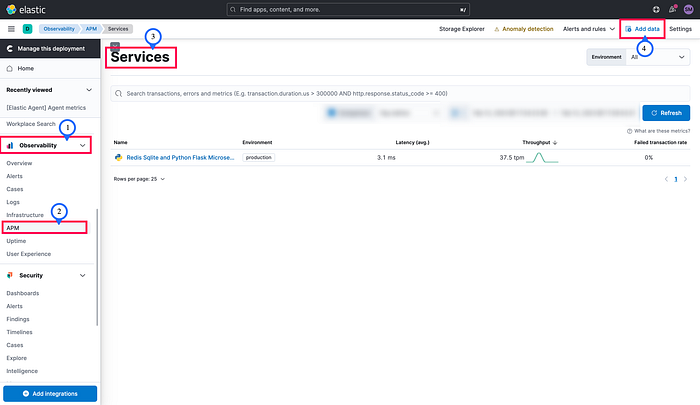
That’s all, the major setup is done. Now, you can directly login to Elasticsearch deployment, go to Observability section and follow the below screenshot to ADD INTEGRATIONS with the Flask application i.e. it is termed as the APM Agent.
As you’re using Elastic Cloud, the APM Server Status ✅ should be online or active if you have included the Integration Server. The Elastic Cloud will automatically does the heavy work for you in installing the APM Server so you can concentrate on the Agents.
Agents are libraries that run inside of your application process. APM services are created programmatically based on the SERVICE_NAME. From the Integration page of Flask, you’ll get the below code snippet with the SECRET TOKEN.
app = Flask(__name__)

# Configure to use ELASTIC_APM in your application's settings
app.config['ELASTIC_APM'] = {
# Set the required service name. Allowed characters:
# a-z, A-Z, 0-9, -, _, and space
'SERVICE_NAME': 'Redis Sqlite and Python Flask Microservice',

# Use if APM Server requires a secret token
'SECRET_TOKEN': 'xXXXXCrlh5XXX6K',

# Set the custom APM Server URL (default: http://localhost:8200)
'SERVER_URL': 'https://02c2630bXXXXXXXXXXXXXXX.apm.us-central1.gcp.cloud.es.io:443',

# Set the service environment
'ENVIRONMENT': 'production',

'DEBUG': 'DEBUG'
}

apm = ElasticAPM(app)
You just need to copy-paste the code to the top of the flask snippet and run the application. To run the application and send logs to the databases, enter the below command in the Terminal.
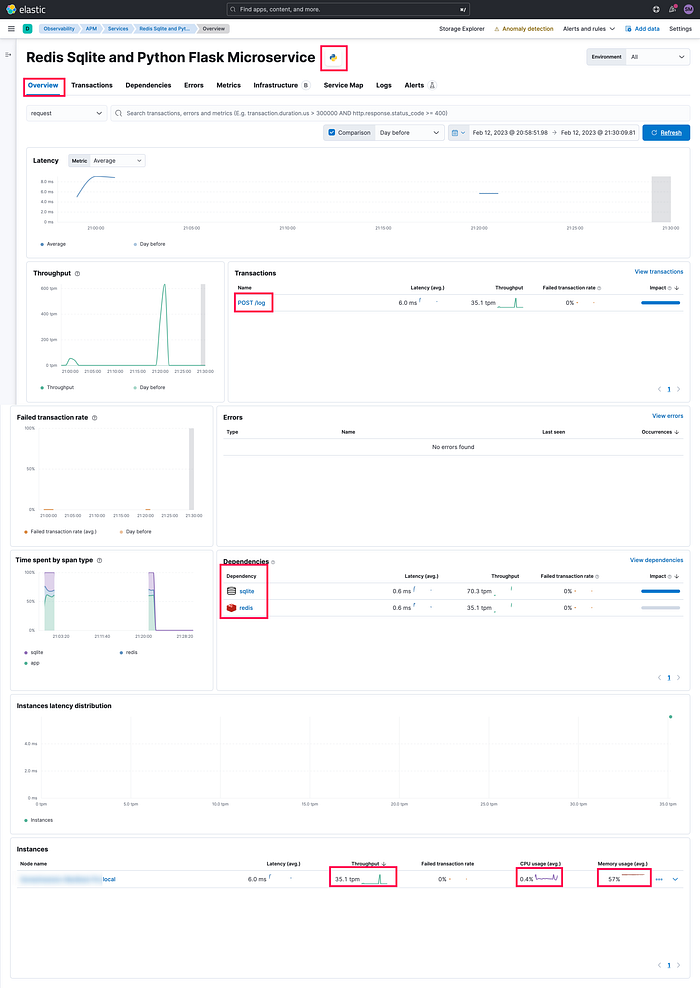
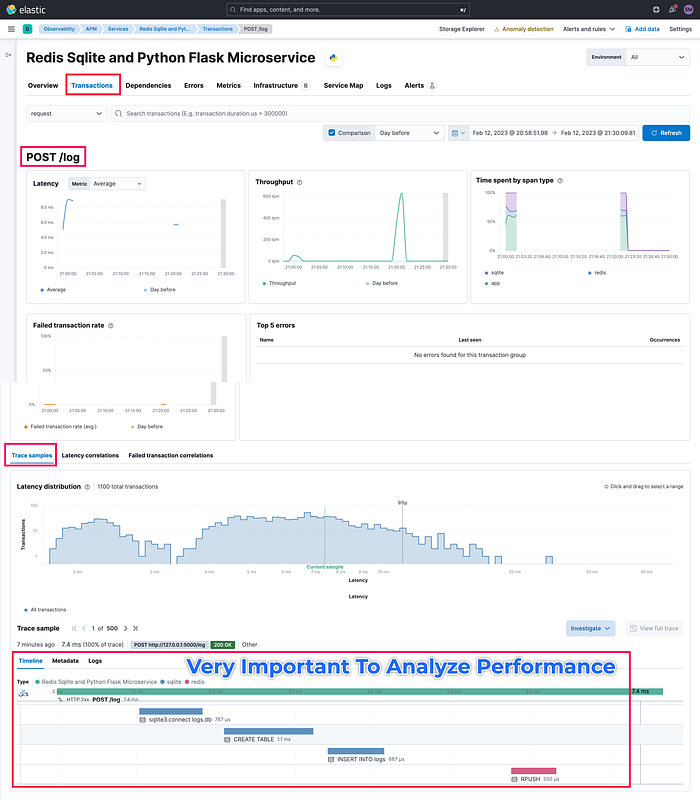
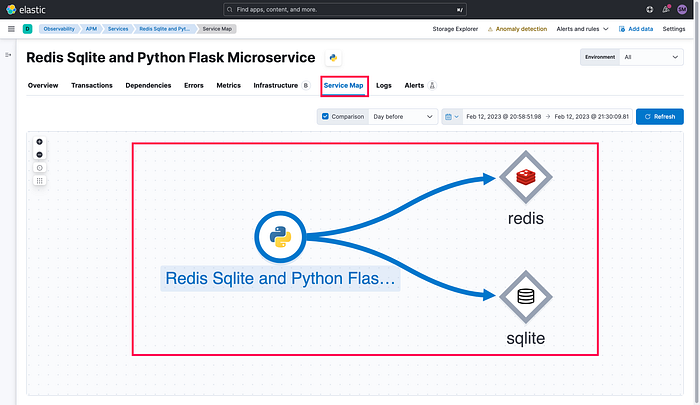
curl -X POST -d "message=test_message" http://localhost:5000/logVoila, the application is started!! Monitored in the Elasticsearch and the transaction logs are pushed to appropriately to the APM Server.
You can check the below screenshots for cross-reference.
I hope you must have learnt something new from this article. I’ll be glad to hear back from you, if you have tried to configure the same from your end.
Thanks for reading!! If you enjoyed this article, please follow and subscribe for the latest updates. Looking for more? Check out the other posts below: